San Francisco Report: RCV is Working as Intended with Positive Voter Experience and Increase in Voter Turnout and Use of Rankings
By Pedro Hernandez
FairVote California has released a comprehensive report providing an overview of how San Francisco voters are using ranked choice voting (RCV) to elect their local officials.
The study shows that more voters use their rankings when a race is competitive and where there are more than two well known candidates, which encourages higher voter turnout and illustrates that this electoral reform is being used as intended. RCV provides voters with greater choice and makes their vote more impactful.
Ranked Ballots are More Democratic Than Runoffs
The percentage of fully ranked ballots had no clear trend over time, but rather appeared to depend more on other factors such as number of candidates and competitiveness. Among the findings, the report showed that 75.4% of ballots had two or three rankings.
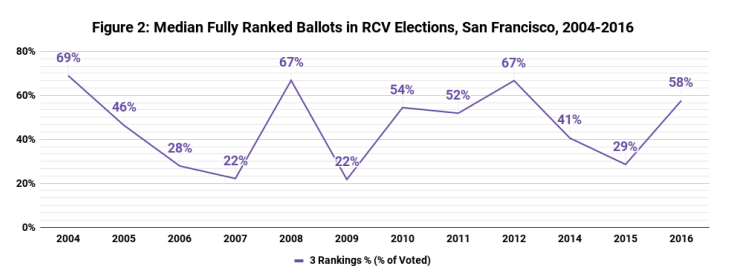
For comparison, in the 14 Board of Supervisors runoff elections that occurred in San Francisco from 2000-2003 (immediately before the implementation of RCV), voter turnout in runoff elections only comprised an average of 62% in the first round of voting. However, with RCV, on average, 84% of ballots validly cast in the first round—whether they ranked one, two, or three—were still active in the decisive final round.
If one values democratic principles of inclusion, then RCV produces elections that include more voters in a final round than a traditional runoff election.
Voters Understand RCV More Over Time
The research found that skipped rankings, where a voter marked a ranking but skipped a column, occur at a low rate, and the rate has continued to drop. In the first four years of RCV races, from 2004-2007, skipped rankings occurred at a rate of less than 1%. The average rate of skipped rankings since 2008 in these multi-candidate single round races is 0.7%.
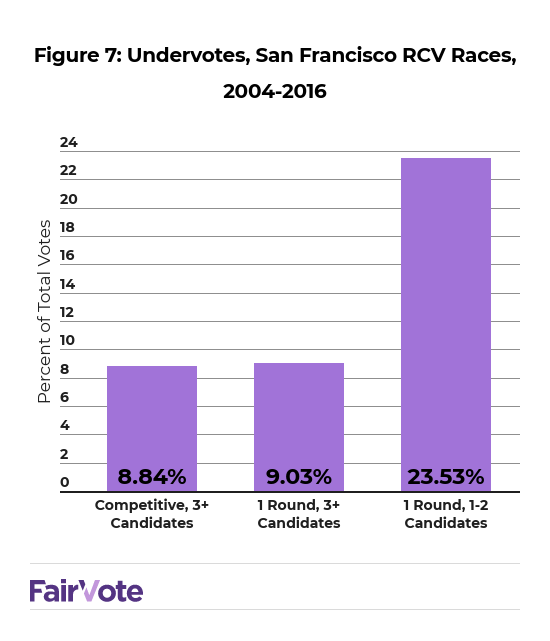
Low Levels of Undervotes
Fewer votes cast “undervotes” with RCV than they did before adoption of RCV, showing increased engagement in local elections. On average, 8.8% of ballots in competitive RCV races had undervotes which means voters chose not to mark their ballots (an undervote is a ballot not counted because the voter chose not to participate in that election). The largest percentage of undervotes was District 2 in 2010, which had an undervote rate of 16.4%. The lowest rate of undervotes was in the Mayoral election of 2011, when 1% of votes had undervotes.
For comparison, the percentage of undervotes in District 10 for casted ballots in the San Francisco School Board race during the same election cycle was 42%, meaning that voters did not participate or decided not to use all of their available votes for School Board. The School Board in San Francisco is elected in an at-large election, meaning multiple candidates win seats in the same election. In 2016, four seats were available, and out of 1,658,112 potential votes by votes at the polls, only 930,592 were cast - an undervote of 44%.
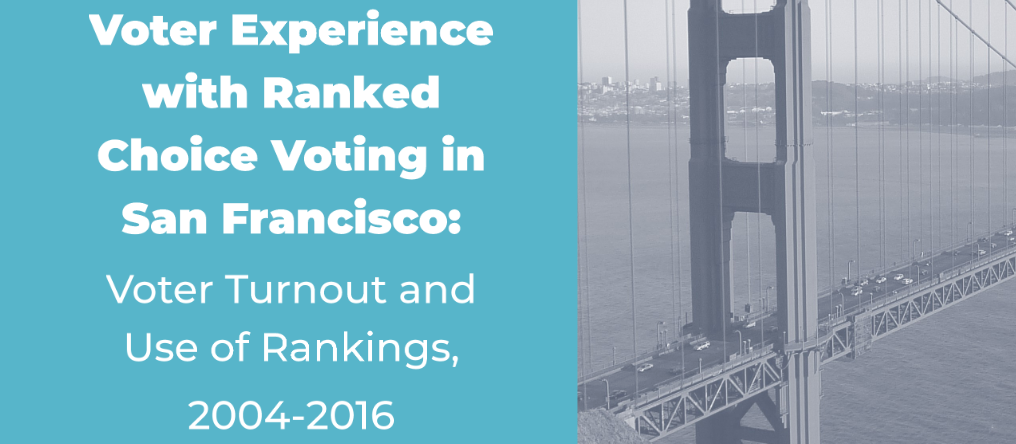
To access the full report: Voter Experience with Ranked Choice Voting in San Francisco: Voter Turnout and Use of Rankings, 2004-2016.
Showing 1 reaction